
A cup and handle on a chart looks exactly like it sounds: a rounded U-shape followed by a small dip on the right. Traders have been using it to time bullish breakouts since 1988. Here is what makes the pattern reliable, where it shows up in crypto, and how to actually trade it without getting faked out.
What Is the Cup and Handle Formation?
The cup and handle formation is a bullish continuation pattern in technical analysis. It looks like a teacup on the price chart: a smooth U-shaped rounded bottom (the cup) followed by a smaller sideways or slightly downward drift (the handle), then a breakout to new highs.
The shape is not arbitrary. Each piece of the pattern represents a specific market psychology phase. The cup is the slow shift from bearish to bullish sentiment as buyers gradually return at lower prices. The handle is the final shake-out of weak hands before the real breakout. The breakout above the handle’s high is the moment buyers finally overpower remaining sellers.
The pattern works on every timeframe and asset class. Originally identified for stocks, it has shown up consistently on Bitcoin and major altcoin charts during every bull cycle since 2013.
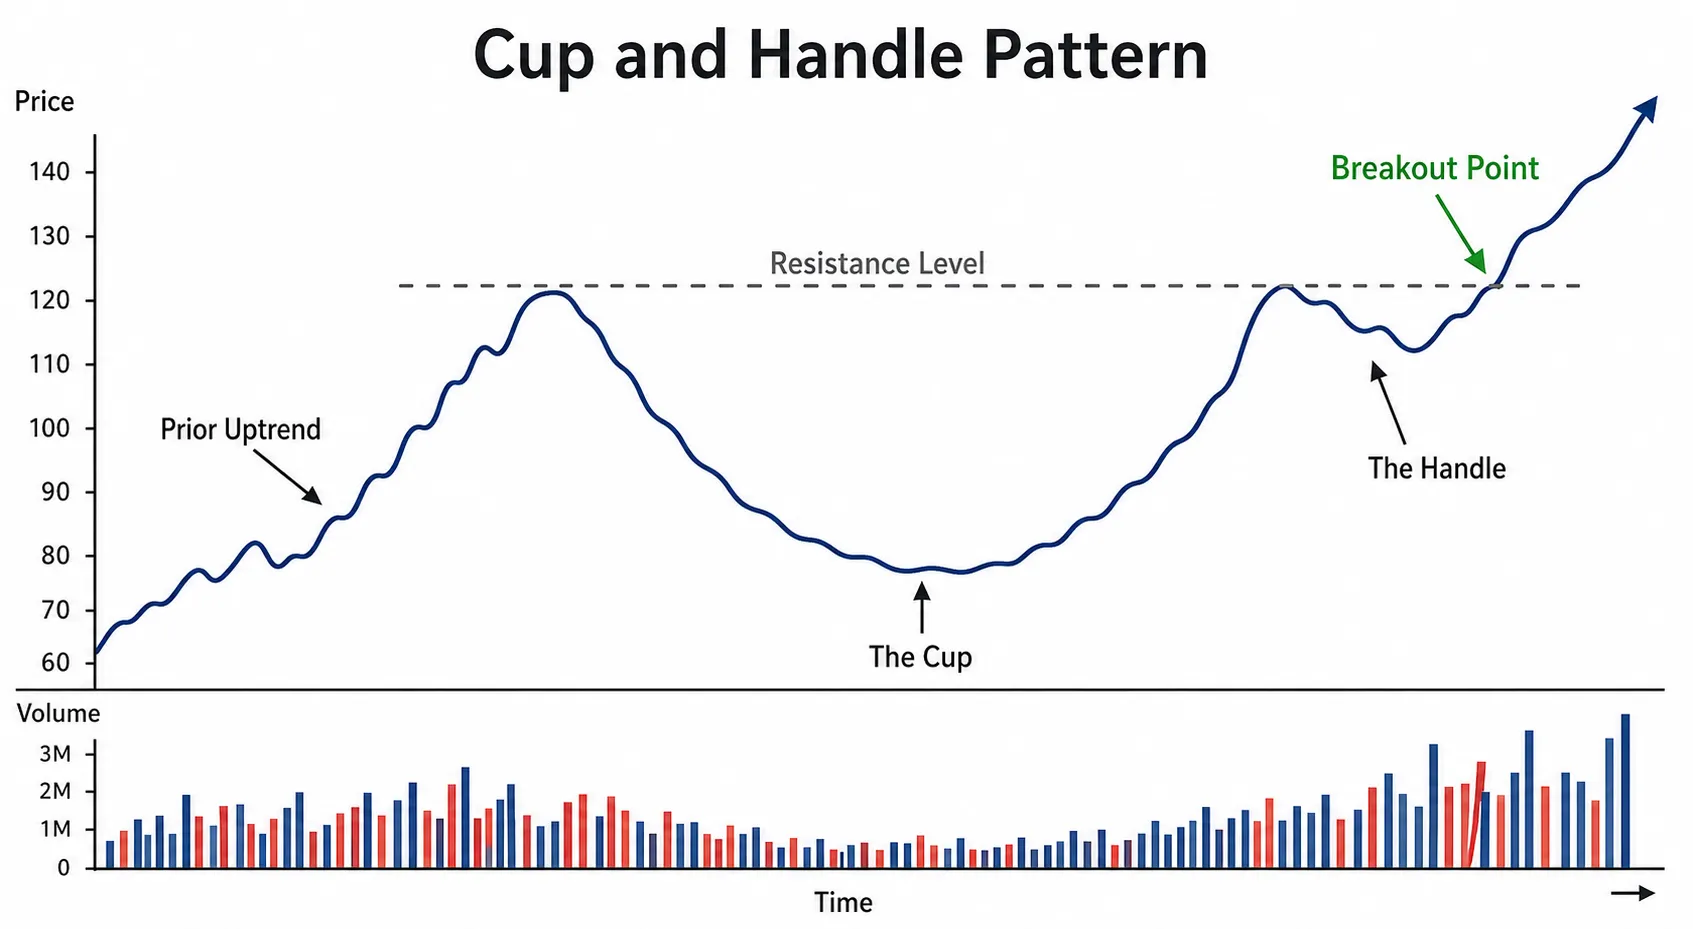
Image example generated by LBank
How the Cup and Handle Pattern Forms
The full pattern unfolds in three distinct stages.
First, the cup formation. Price drops from a previous high, finds a base, then slowly rounds back up toward the previous high. The shape should be smooth. A V-shaped recovery is too fast and indicates the sentiment shift was not real. A proper cup takes weeks to months on daily charts and can span over a year on weekly charts.
Second, the handle formation. After the cup approaches its previous high, price stalls and pulls back slightly. This handle is typically a sideways consolidation or a mild downward drift. It usually lasts about one-quarter to one-third the duration of the cup.
Third, the breakout. Volume expands as price punches through the handle’s resistance level. A clean breakout closes above the handle’s high on a strong volume bar. That close is the trigger.
A useful reference: the cup represents accumulation, the handle represents one last test, and the breakout is confirmation.
Where the Cup and Handle Pattern Came From
William O’Neil introduced the cup and handle pattern in his 1988 book How to Make Money in Stocks. O’Neil was a stockbroker and the founder of Investor’s Business Daily, where he developed the CAN SLIM investing methodology. CAN SLIM is a seven-factor framework for picking growth stocks, and the cup and handle is the technical-analysis component of the system.
O’Neil studied price charts of the biggest stock winners over decades and noticed that most of them broke out from a similar base shape before their major moves. He called this base the “cup with handle” and built specific criteria for what made one valid: depth between 12% and 33%, smooth rounded base, handle drift no more than 12% off the cup’s right rim, increasing volume on the breakout.
The pattern has held up across asset classes since then. Crypto traders adopted it almost immediately because Bitcoin’s boom-and-bust cycles produce the kind of long base patterns the cup and handle describes.
How to Identify a Valid Cup and Handle Pattern
Not every U-shape is a cup and handle. The pattern only counts when several conditions are met.
Use this checklist:
- Prior uptrend. The pattern must form after a clear move higher. It is a continuation, not a reversal.
- Cup depth. Drop from the cup’s left rim to the bottom should be roughly 15% to 30% in stocks, or one to two times the asset’s average true range in crypto and forex. Deeper than that and the pattern is more risk than setup.
- Smooth rounded bottom. No V-shapes. The base should look like a saucer, not a wedge.
- Cup duration. Weeks to months on daily charts. Anything formed in days is too quick.
- Handle drift. Sideways or slightly down. The handle should not erase more than half the gain of the cup’s right side.
- Handle duration. About 25% to 33% of the cup’s length.
- Volume signature. Volume contracts during cup formation, dries up further during the handle, and expands sharply on the breakout.
Patterns that miss any one of these are weaker setups, not invalid, but the win rate drops.
How to Trade the Cup and Handle Formation
The trade has three components: entry, stop, and target.
The entry is a close above the handle’s high on rising volume. Some traders take the breakout intraday at the moment price punches through. Others wait for a daily or weekly close above the level to filter false breakouts. Closing-bar entries are slower but cleaner.
The stop loss sits below the handle’s low. If price falls back into the handle, the breakout failed and the pattern is invalidated. Exit, take the small loss, and move on.
The price target is calculated by measuring the depth of the cup from the rim to the bottom and projecting that distance up from the breakout point. This is the textbook target. Many traders add a partial trail-stop after the target hits, since cup-and-handle breakouts in trending markets often run far past the projection.
For position sizing, the crypto calculator helps compute the dollar exposure of any given size at the breakout price, which matters when the per-token cost is unusual.
Cup and Handle Examples in Crypto Markets
The cup and handle has produced some of the cleanest setups in crypto history. A few examples:
- Bitcoin in 2020. A roughly year-long cup formed from BTC’s 2019 peak around $14,000 down to the March 2020 capitulation low and back up. The handle drifted sideways through summer 2020. The breakout above $14,000 in October 2020 launched the move to $69,000.
- Bitcoin in late 2023. A multi-month cup with handle formed on the BTC weekly chart between $25,000 and $30,000. The breakout above $32,000 in October 2023 preceded the move to all-time highs.
- Ethereum 2020 to 2021. ETH formed a shallower cup-and-handle on its weekly chart through 2020 before breaking out to roughly $4,800 in late 2021.
These are not cherry-picked. The pattern repeats in crypto because the same mechanics apply: sustained accumulation, a final shakeout, and a breakout when supply runs out.
Common Cup and Handle Mistakes to Avoid
The pattern fails for predictable reasons. Three to watch for:
- Trading the V instead of the U. A sharp V-shaped recovery is not a cup. Sentiment did not have time to shift, and the breakout that follows is much less reliable. If the chart looks like a checkmark instead of a saucer, skip it.
- Ignoring volume. A breakout on weak volume is a false breakout most of the time. Real cup-and-handle breakouts come with a noticeable expansion in trading volume on the breakout bar. No volume, no trade.
- Setting the stop too tight. The handle is supposed to wobble. Putting the stop just one or two ticks below the handle’s low gets stopped out by normal noise. Place the stop with enough room for the handle’s normal range, even if it widens the per-trade risk.
For ongoing market analysis on which crypto charts are setting up valid technical patterns, LBank Explore covers the latest setups across major coins.
The cup and handle is one of the more reliable patterns when its conditions are met, but reliability does not mean certainty. Treat it as a setup with a positive expected value over many trades, not a magic signal on any single chart. The traders who do best with it are the ones who pass on the dozens of mediocre cups every cycle and only act on the textbook ones.
Cup and Handle Formation: Frequently Asked Questions
Related Articles
Mastering Classic Chart Patterns
This article delves into the application of classic chart patterns in financial markets, emphasizing their significance as technical analysis tools for uncovering price movement patterns and forecasting trends. By examining flag, triangle, wedge, double top-bottom, and head-and-shoulders formations, the critical role of pattern integrity, volume confirmation, time cycles, and breakout confirmation in effectively identifying these patterns is underscored. The reader is reminded that while utilizing classic chart patterns to guide trading, it is essential to focus on risk management, incorporate multi-dimensional information, and continually update analytical methods and tools.

What Is Scalping Trading in Cryptocurrency?
This article delves into the practical application of day trading in financial markets, particularly in the realm of cryptocurrencies. It emphasizes that this strategy relies on precise real-time data analysis and quick decision-making abilities to capitalize on small price fluctuations for short-term gains. The article breaks down essential elements used by day traders, such as chart patterns, momentum indicators, and time frame selection, and highlights the psychological preparation and stringent risk management required when implementing this approach in the highly competitive and volatile cryptocurrency market. Lastly, the article encourages potential day traders to thoroughly understand their own characteristics and market dynamics before entering this field, and to explore through simulated trading and other methods to make rational decisions and achieve long-term stable profits.

Unveiling the Secrets of Trendlines
This article delves into the application and value of trend lines in analyzing financial market charts. It reveals the fundamental principles, types, practical applications, and combined use with other technical indicators in drawing trend lines. Trend lines connect specific price points to disclose the overall trend of price movements, becoming a crucial tool for identifying market direction, support levels, and resistance levels. The article emphasizes the differences in trend line analysis under various scale settings and the necessity of combining multiple technical indicators, such as Ichimoku Cloud and Bollinger Bands, to enhance the accuracy of trend lines. By providing an in-depth analysis of trend lines, this article aims to help readers better understand and apply the trend line tool to make more informed decisions in complex financial markets.