Candlestick Charts Made Simple? Rethinking Candlesticks from a Trader’s Perspective (Part 1)

LBank 官方中文
2026-02-22
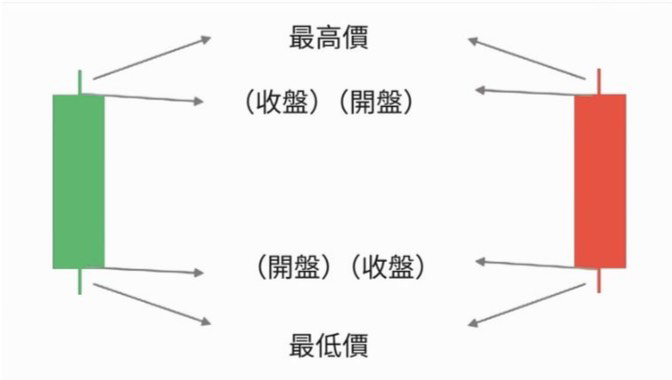
The candlestick chart is essentially the language of market sentiment. When you understand candlesticks, it's like being able to hear what the market is "saying" right now.
Many people start learning trading by studying candlesticks, but it's also where most get stuck. The reason isn't that candlesticks are difficult, but because no one teaches you how to view them from a trader's perspective.
In this article, we will first clarify the basic logic behind candlesticks.
All views expressed are the author’s personal opinions, and do not constitute investment advice.