Date | Open price* | Upper Price | Lower Price | Close price** | Vol |
|---|
2026-07-09 | -- | $7.7 | $7.54 | -- | -- |
2026-07-08 | -- | $7.7 | $7.54 | -- | -- |
2026-07-07 | -- | $7.7 | $7.54 | -- | -- |
2026-07-06 | -- | $7.7 | $7.54 | -- | -- |
2026-07-05 | -- | $7.7 | $7.54 | -- | -- |
2026-07-04 | -- | $7.7 | $7.54 | -- | -- |
2026-07-03 | -- | $7.7 | $7.39 | -- | -- |
2026-07-02 | -- | $8.44 | $7.56 | -- | -- |
2026-07-01 | -- | $8.45 | $7.95 | -- | -- |
2026-06-30 | -- | $8.8 | $7.96 | -- | -- |
2026-06-29 | -- | $8.28 | $7.69 | -- | -- |
2026-06-28 | -- | $7.86 | $7.77 | -- | -- |
2026-06-27 | -- | $7.98 | $7.72 | -- | -- |
2026-06-26 | -- | $7.94 | $7.38 | -- | -- |
2026-06-25 | -- | $8.26 | $7.66 | -- | -- |
2026-06-24 | -- | $8.92 | $7.87 | -- | -- |
2026-06-23 | -- | $9.17 | $8.52 | -- | -- |
2026-06-22 | -- | $9.53 | $8.8 | -- | -- |
2026-06-21 | -- | $9.46 | $9.27 | -- | -- |
2026-06-20 | -- | $9.55 | $9.36 | -- | -- |
* Earliest data in range (UTC time)
** Latest data in range (UTC time)
About ONDS historical price data
The ONDS price history tracker allows cryptocurrency investors to conveniently monitor the performance of their investments. You can easily view the opening, highest, and closing prices of ONDS over time, as well as the trading volume. In addition, you can instantly check the daily percentage change to easily identify days with higher volatility.
According to our ONDS price history data, its value surged to an all-time high of over $13.89 in 2026-06-02. On the other hand, the lowest point in the ONDS price trajectory (often referred to as the “ONDS all-time low”) occurred in 2026-05-29. Anyone who purchased ONDS during that period would currently enjoy an impressive profit of $13.89.
By design, the total supply of ONDS will reach --. As of now, the circulating supply of ONDS is approximately --.
All prices shown on this page come from trusted data provider LBank. When reviewing your investments, it is recommended not to rely on a single data source, as values may differ between providers.
Our historical Bitcoin price dataset includes 1-minute, 1-day, 1-week, and 1-month data (open/high/low/close/volume). These datasets have been rigorously tested to ensure consistency, integrity, and accuracy. The design is specifically for trading simulations and backtesting, available for free download and updated in real time.
ONDS historical data examples
Here are some uses of ONDS historical data in ONDS trading
Technical analysis:
Traders use historical data to analyze trends and movements in the ONDS market. They use charts and other visual tools to identify trends and determine when to enter or exit the market. One way to gain an advantage in this dynamic market is to visualize and analyze historical market data. To achieve this, historical data can be stored in GridDB and analyzed using Python scripts with various libraries, such as Matplotlib, Pandas, Numpy, and Scipy for data visualization.
Predicting ONDS price based on historical data:
Historical data can also be used to predict future market trends. By analyzing past market behavior, traders can identify recurring patterns and make informed predictions about the direction of the ONDS market. By using LBank’s ONDS historical dataset, traders can obtain minute-by-minute data such as open, high, low, and close prices for ONDS. These data can then be used to define and train price prediction models, helping users make informed trading decisions.
Risk management:
By obtaining historical data, traders can assess the risks of investing in ONDS. They can also determine the volatility of ONDS, allowing them to make sound investment decisions.
Portfolio management:
Historical data is also useful in portfolio management. By tracking investments over the long term, traders can identify underperforming assets and adjust portfolios to maximize returns.
Training ONDS trading bots:
In addition, users can choose to download ONDS historical cryptocurrency OHLC (open, high, low, close) data to train their own ONDS trading bots, achieving outstanding performance in the market. With these tools and resources, traders can deeply study ONDS’s historical data, gain valuable insights, and potentially improve their trading strategies.
How to analyze ONDS candlestick chart data
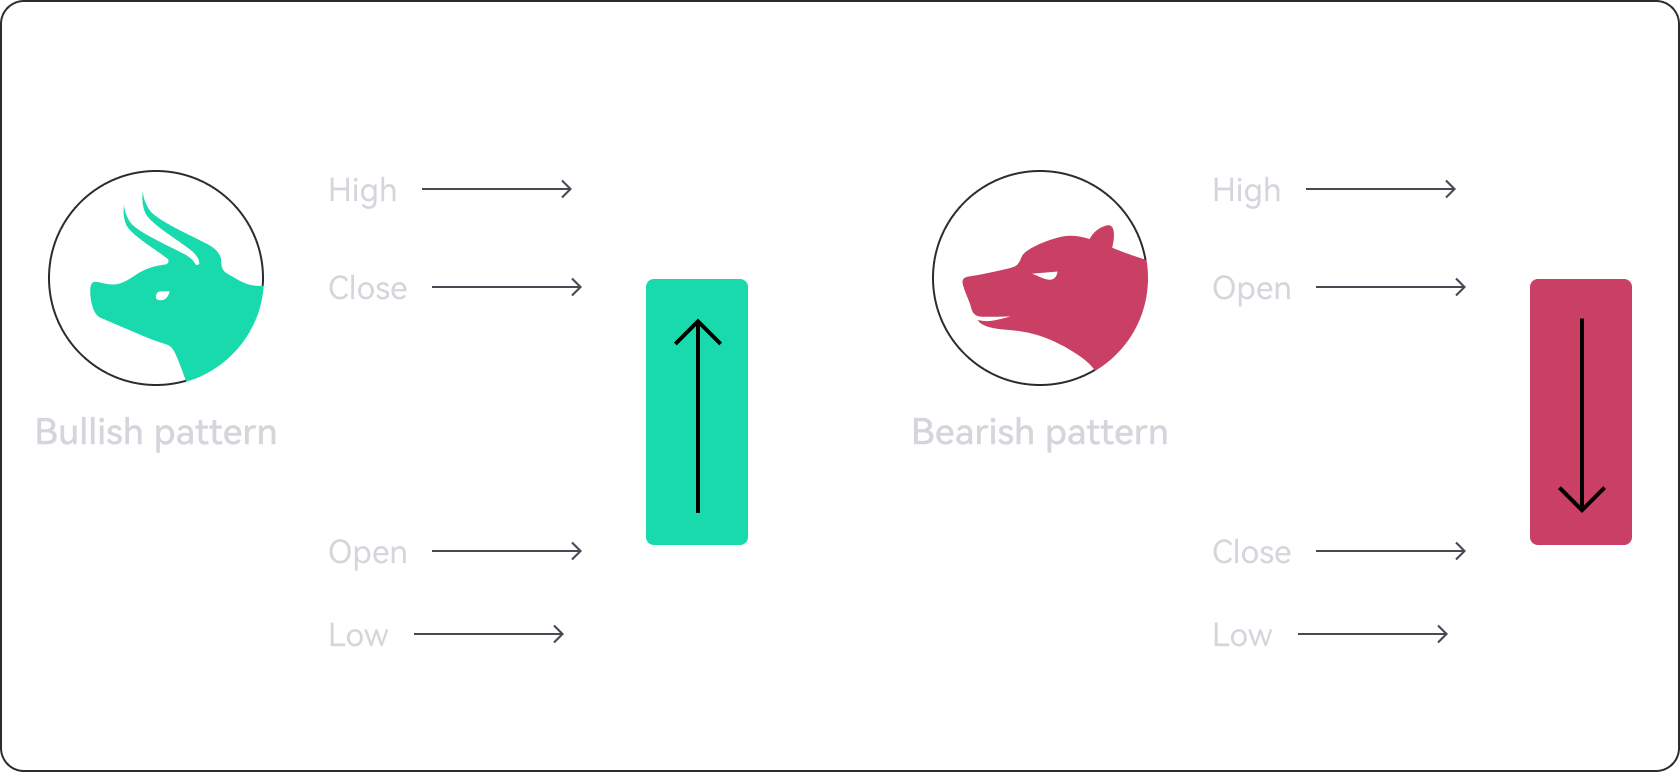
ONDS candlestick charts display time on the horizontal axis and price data on the vertical axis, similar to line and bar charts. A candlestick may have two different colors: green or red. A green candle indicates a price increase during the considered period, while a red candle indicates a price decrease.
The simple structure of candlestick charts can provide users with a wealth of information. For example, technical analysis may use candlestick chart data to identify potential trend reversals.
According to ONDS historical data, when the ONDS market shows bearish or bullish trends, conservative investors may choose to use capital-protected products such as Flexible and Locked to capture the trend at that time. When ONDS is in a sideways trend, using Open Futures and selecting a bullish product to take advantage of a slight upward trend, or choosing a bearish product to profit from a mild downward trend, may lead to better performance. 
 onds(ONDS)